About the Project
Source: Graduate Student Capstone Project - Harvard University Extension School
My Role: Entire design process from research to final design, full stack application development using the MEAN technology stack
Project Time: 8 months
This project is the culmination of a thirty-two-week degree capstone project at Harvard University Extension School. I deepened my user experience knowledge and skills, received mentoring, and expanded my development skillset to new technologies.
The Problem
An allergy to nickel is the most common contact allergy in the world. For some, the allergy is severe enough to cause systemic reactions in the body, primarily in the skin (dermatitis, eczema) but also migraines and gastrointestinal symptoms.
This condition is managed by avoiding contact with nickel as much as possible. This includes avoiding touching surfaces that contain nickel and eating a low-nickel diet. Researchers estimate that around 11% of those with an allergy have one severe enough to recommend a low-nickel diet. Nickel occurs naturally in many foods that absorb it from the soil in which they are grown or the water they live in. It can also be added to foods through cooking and processing (i.e. canned food).
Following a low-nickel diet is a challenge and a burden for nickel allergy sufferers who must keep their daily nickel consumption below a certain threshold.
Source:
Antico, Andrea, Soana, Roberto. “Nickel sensitazion and dietary nickel are a substantial cause of symptoms provocation in patients with chronic allergic-like dermatitis syndromes.” Allergy & Rhinology, vol. 6, no. 1, 2015, pp. 56-63.
The Solution
The Low-Nickel Living web application enables users to log their meals and track their nickel consumption. They can make informed decisions about their food throughout the day with at-a-glance knowledge of how they are tracking today and over time. By using a simple, research-backed points system, following a low-nickel diet and staying below the recommended threshold of dietary nickel can become manageable. Users can look up the nickel content of foods, log their meals, and see their data over time. The Low-Nickel Living application helps people feel like they can still thrive when living with a nickel allergy.
Competitor Analysis
I researched competitors available and discovered a gap in the market for The Low-Nickel Living application. The nearest competitor is the Nickel Navigator mobile app, which was launched in 2019. Nickel Navigator is a mobile app that provides a basic diet tracker of the total micrograms of dietary nickel consumed based on averages of multiple data sources. It includes a database of foods to search with the nickel content from different regions and references to all sources. It also includes a Journal for logging what the user eats throughout the day and displaying total micrograms of dietary nickel consumed. The user searches for a food and then enters the ounces of the food that was eaten. It also contains a reference guide with information about the app as well as about other nickel allergy-related lifestyle changes.
Pros
The app consolidates data from multiple sources, including location, and averages them for the user. There are visual graphs of the different study results of nickel content of a specific food to see where the bulk of studies rate that food. It is very easy to find the references used to compile the data. Overall, this app excels at making the data accessible.
Cons
The user experience of the diet journal leaves a lot to be desired. There is nothing visual, just a list of foods, their average micrograms of dietary nickel, and a total number of micrograms. There is no comparison of the daily total to the user’s goal or view of how much the user has left in their daily allotment. There is no view of how many days the user has stayed under the threshold or gone over it. The daily food journal in the app only uses micrograms of Nickel, though the points system from the Low-Nickel Diet Scoring System for Systemic Nickel Allergy6 is provided in the detailed research on the company website. The nickel points system is simpler and easier to use and understand than micrograms. There is no web version, only the mobile app.
User Research
The audience for this application is people with a severe nickel allergy or their caregivers. In researching the people affected by this allergy, I learned that it impacts more women than men.
Nickel allergy is the most common contact allergy in the United States1. It is estimated that up to 17% of women and 3% of men are allergic to nickel in the United States2 and that more than 1.1 million children in the United States are potentially sensitized to nickel1. Researchers also estimate that around 11% of those with an allergy have one severe enough to recommend a low-nickel diet5.
Statistically many people have a nickel allergy severe enough to benefit from a low-nickel diet. Also, this need is growing. In the United States especially, the nickel allergy has become much more common over the last several decades.1 It nearly quadrupled among children.1
Nickel is also the most common contact allergy in the world.1 The prevalence of nickel-allergies in Europe is less than in the United States because the EU had enacted restrictions on the amount of nickel contact in consumer products. Even with those restrictions, the allergy is still common. Even the small percentage of people with the severe form of the allergy translates to large numbers worldwide.
For another view of how many people are invested in managing their nickel allergy, The Low Nickel Diet & Lifestyle Facebook group has 4,512 members as of October 22, 20218. There have been more than 1,000 downloads of the Nickel Navigator app for Android since its launch on June 4, 20199. It is important to note that for a long time there were not very many resources for those diagnosed with a nickel allergy outside of scholarly papers. These consumer-friendly resources are relatively new and not widely adopted yet.
User Personas
The Newbie
The first is a young adult woman who was recently diagnosed and is overwhelmed by learning all of the related lifestyle changes.
Highly Sensitive
The second is a woman who has been living with this condition for a while and needs to be very strict about what she eats. She desires tools and data.
The Caregiver
The third is a mother of a child with a severe nickel allergy who is lookign for support and a sense of control. She needs a tool to be quick and easy.
Empathy Maps
I also created empathy maps for each persona to better understand each perspective.
Wireframes / Prototype
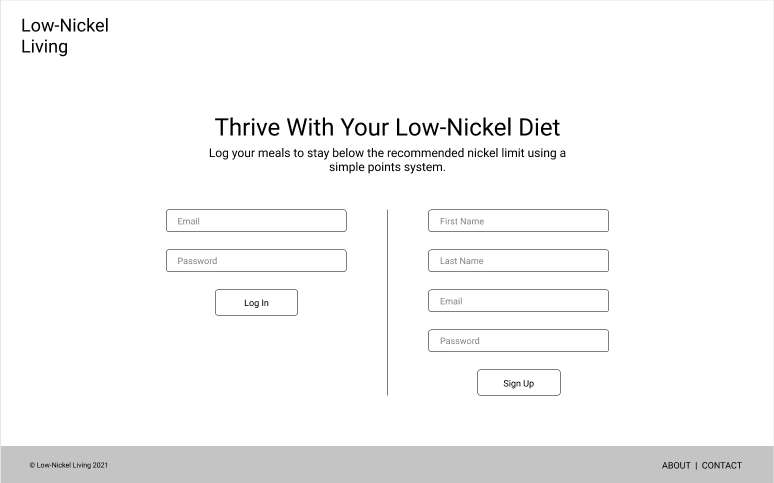
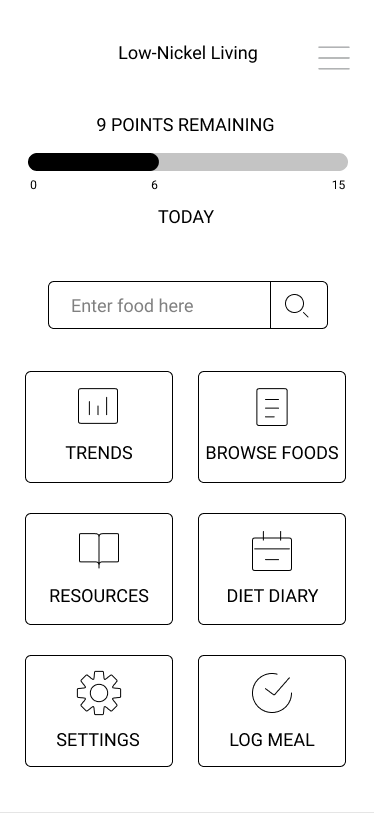
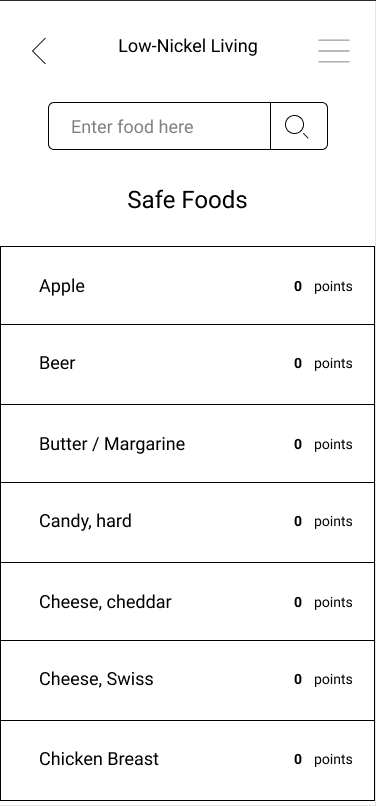
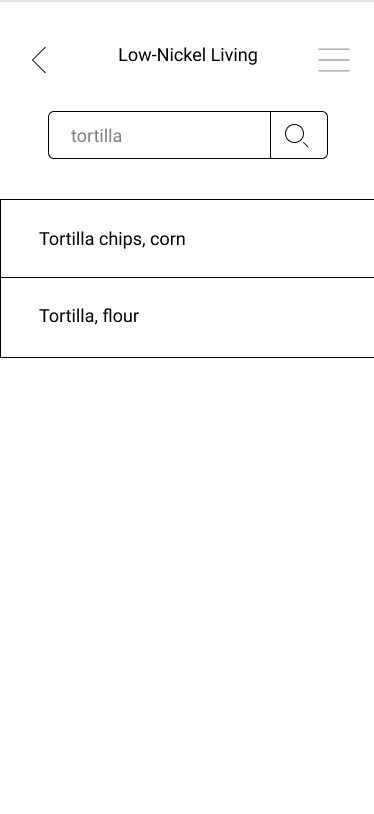
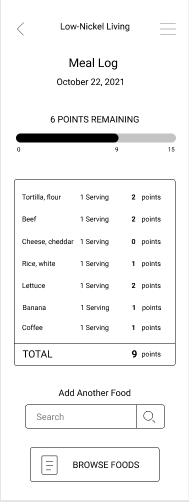
I used Figma to create low-fidelity wireframes.





Technologies
I used Figma and Canva for design work.
I coded the application using the MEAN development stack: MongoDB, Express, Angular, and Node. (This included coding in HTML, CSS, JavaScript, and TypeScript.)
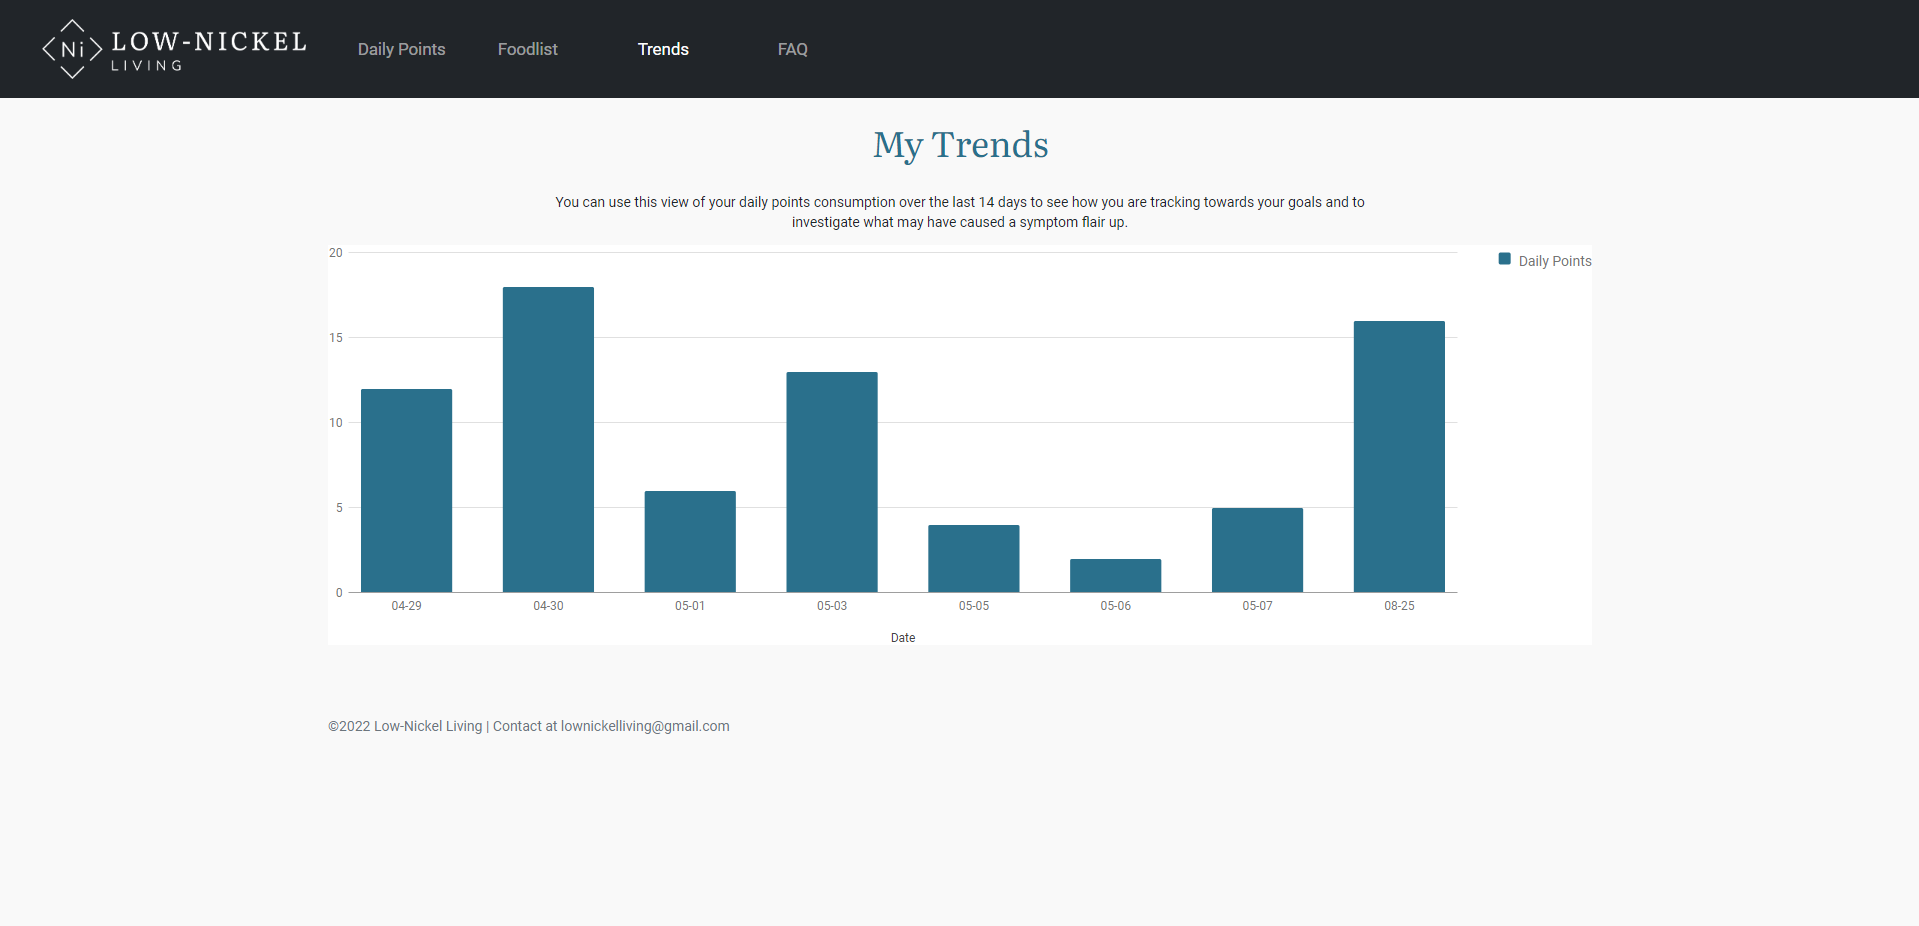
I also used Mongoose for working with my MongoDB database, GitHub for version control, Passport for authentication and authorization, Bootstrap for layout and some UI elements, and Google Charts for data visualization.
Visual Design
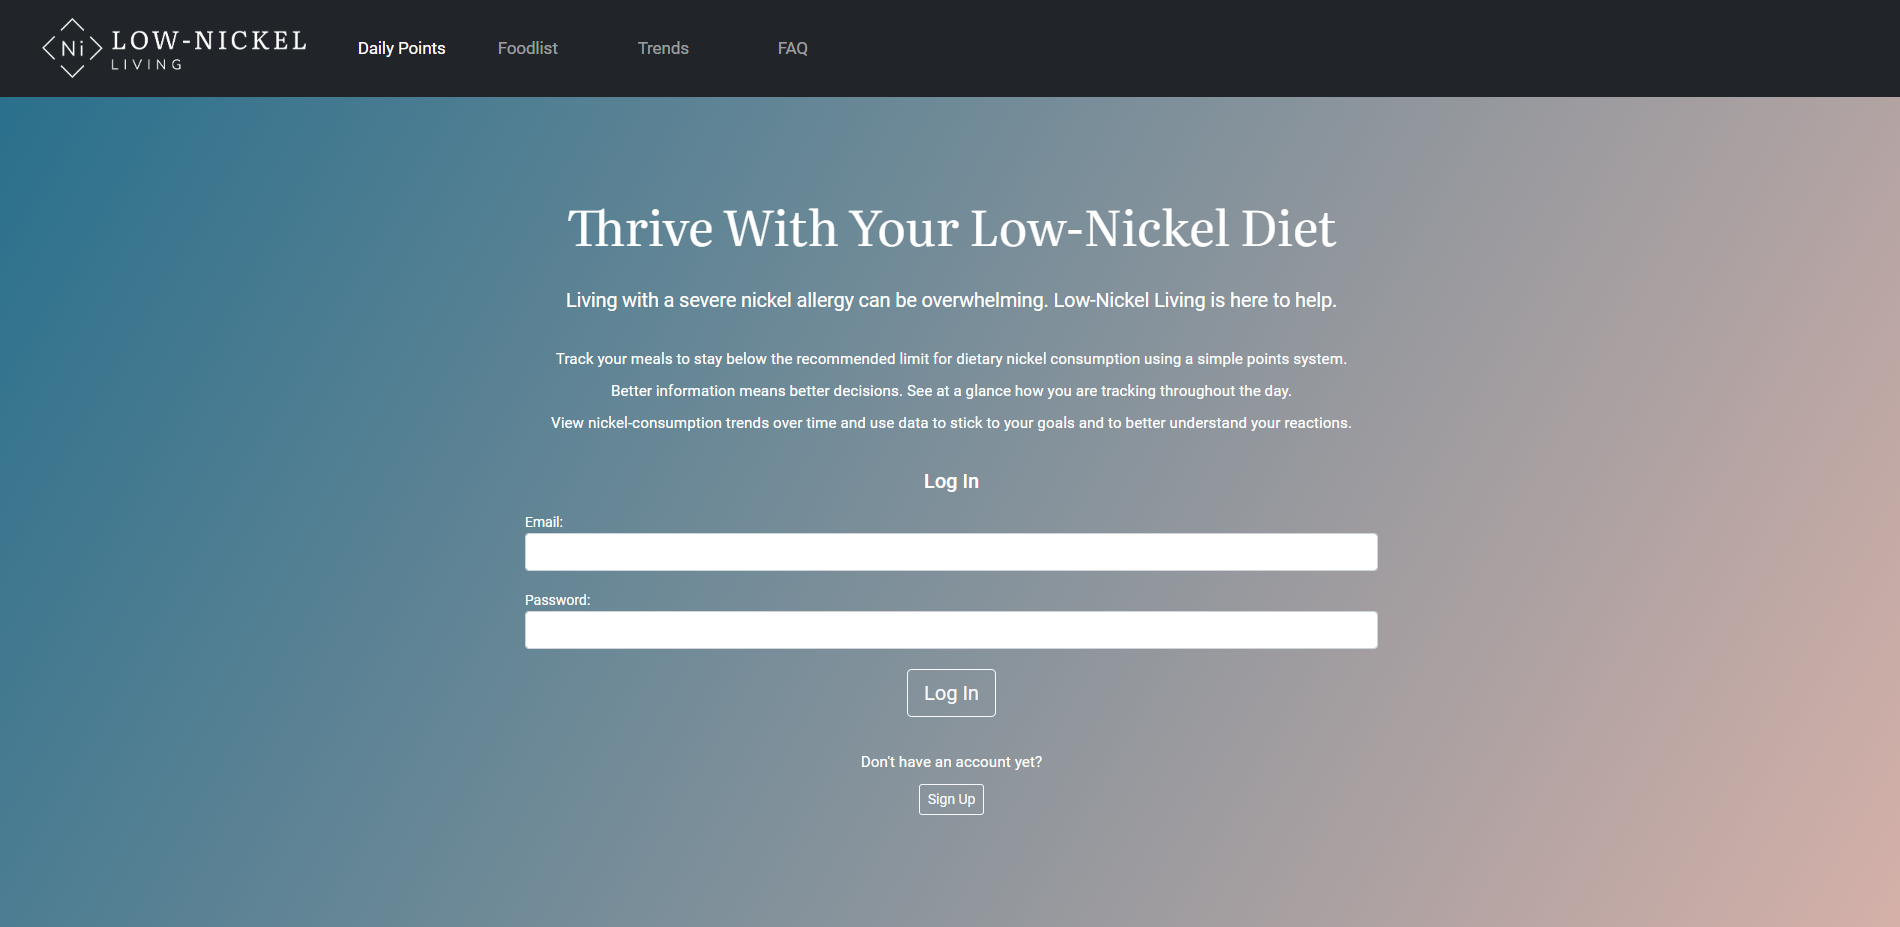
My goal with the visual design of the application was to create a calming cornerstone to the user's day. I used a modern serif font for the logo and headings to convey trustworthiness and highlight the academic research underpinning the application and the tracking methodology.
I also used a trendy gradient on the landing page to provide the confidence and enjoyment that comes with using a modern application. Dark teal, the primary color, nods to the calming aspect of blue and the renewing, health-focused aspects of green. It is a bold, strong color, inspiring action. These are qualities I wanted for an application that enables users to succeed with a major lifestyle change.
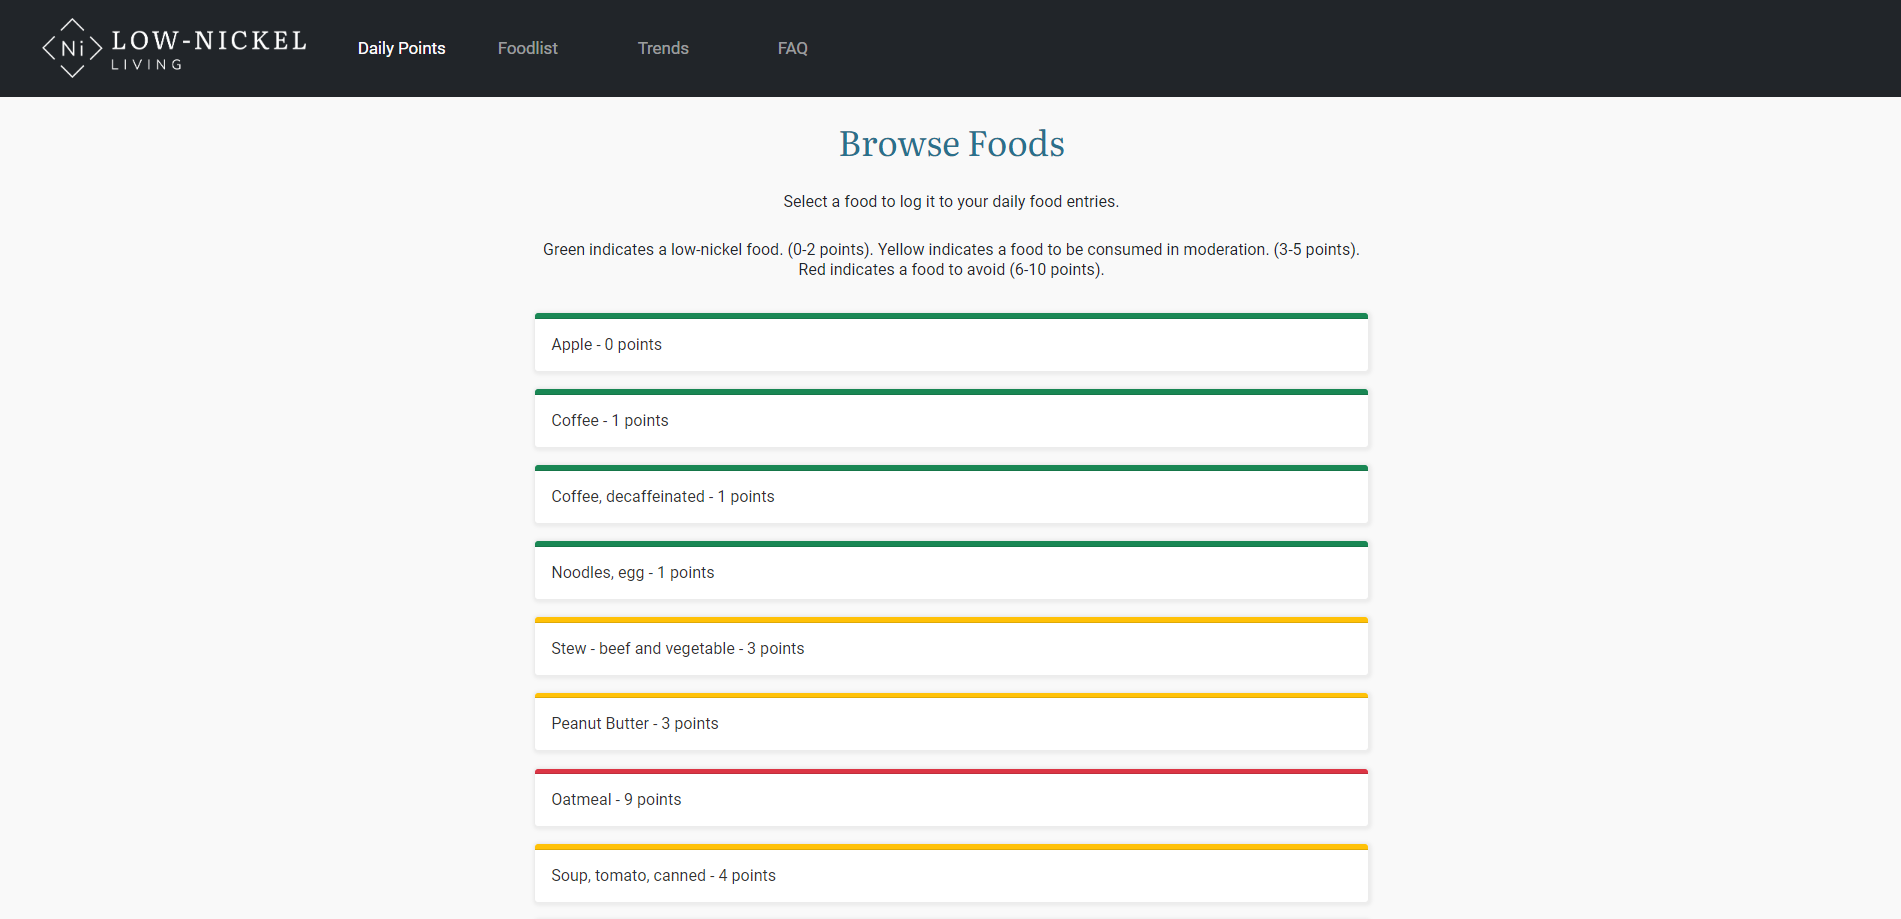
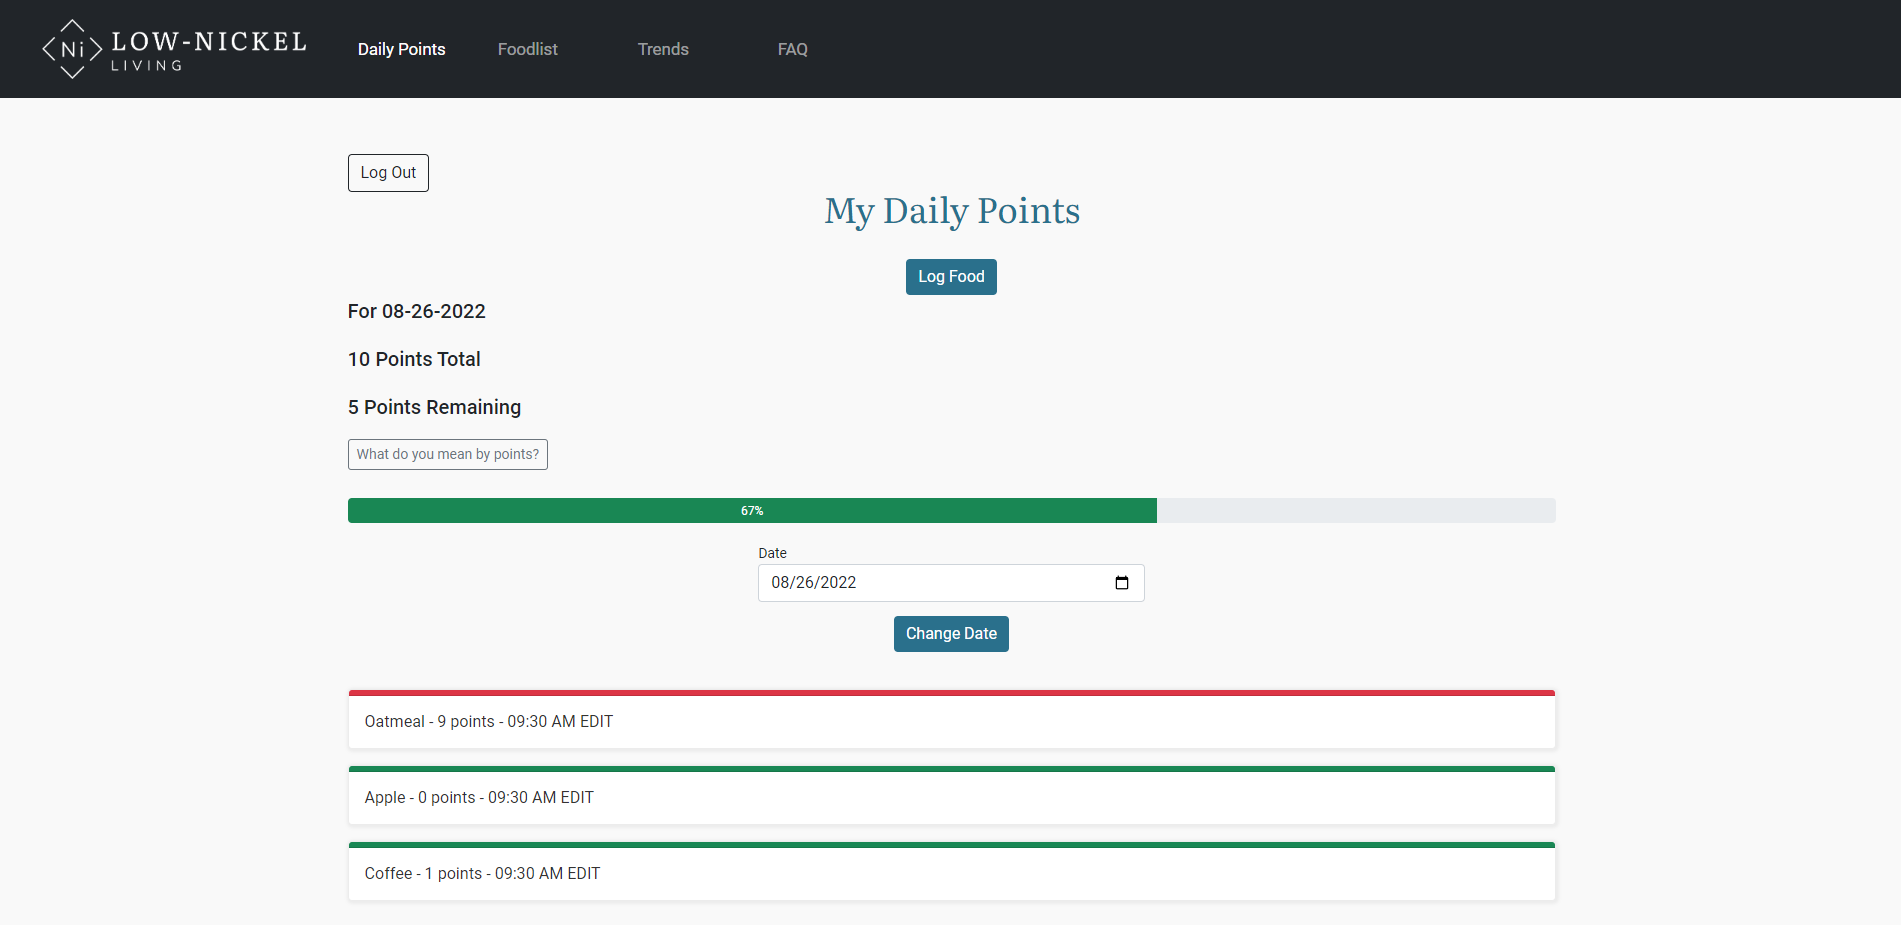
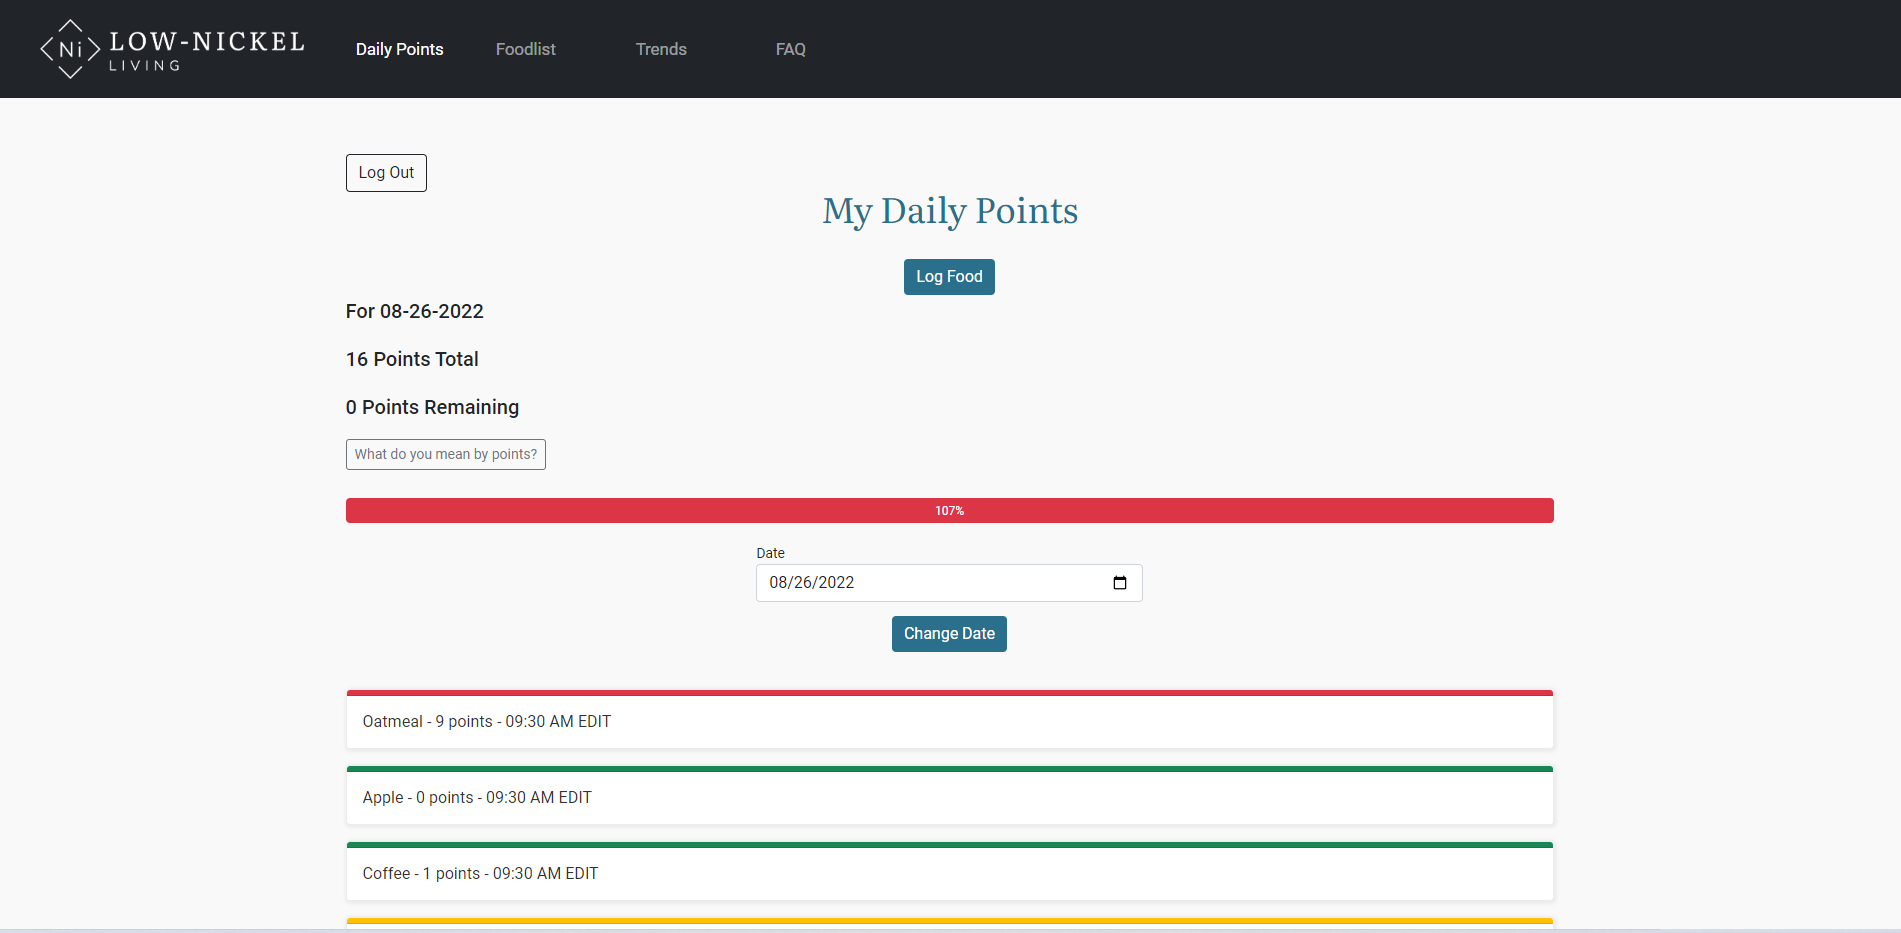
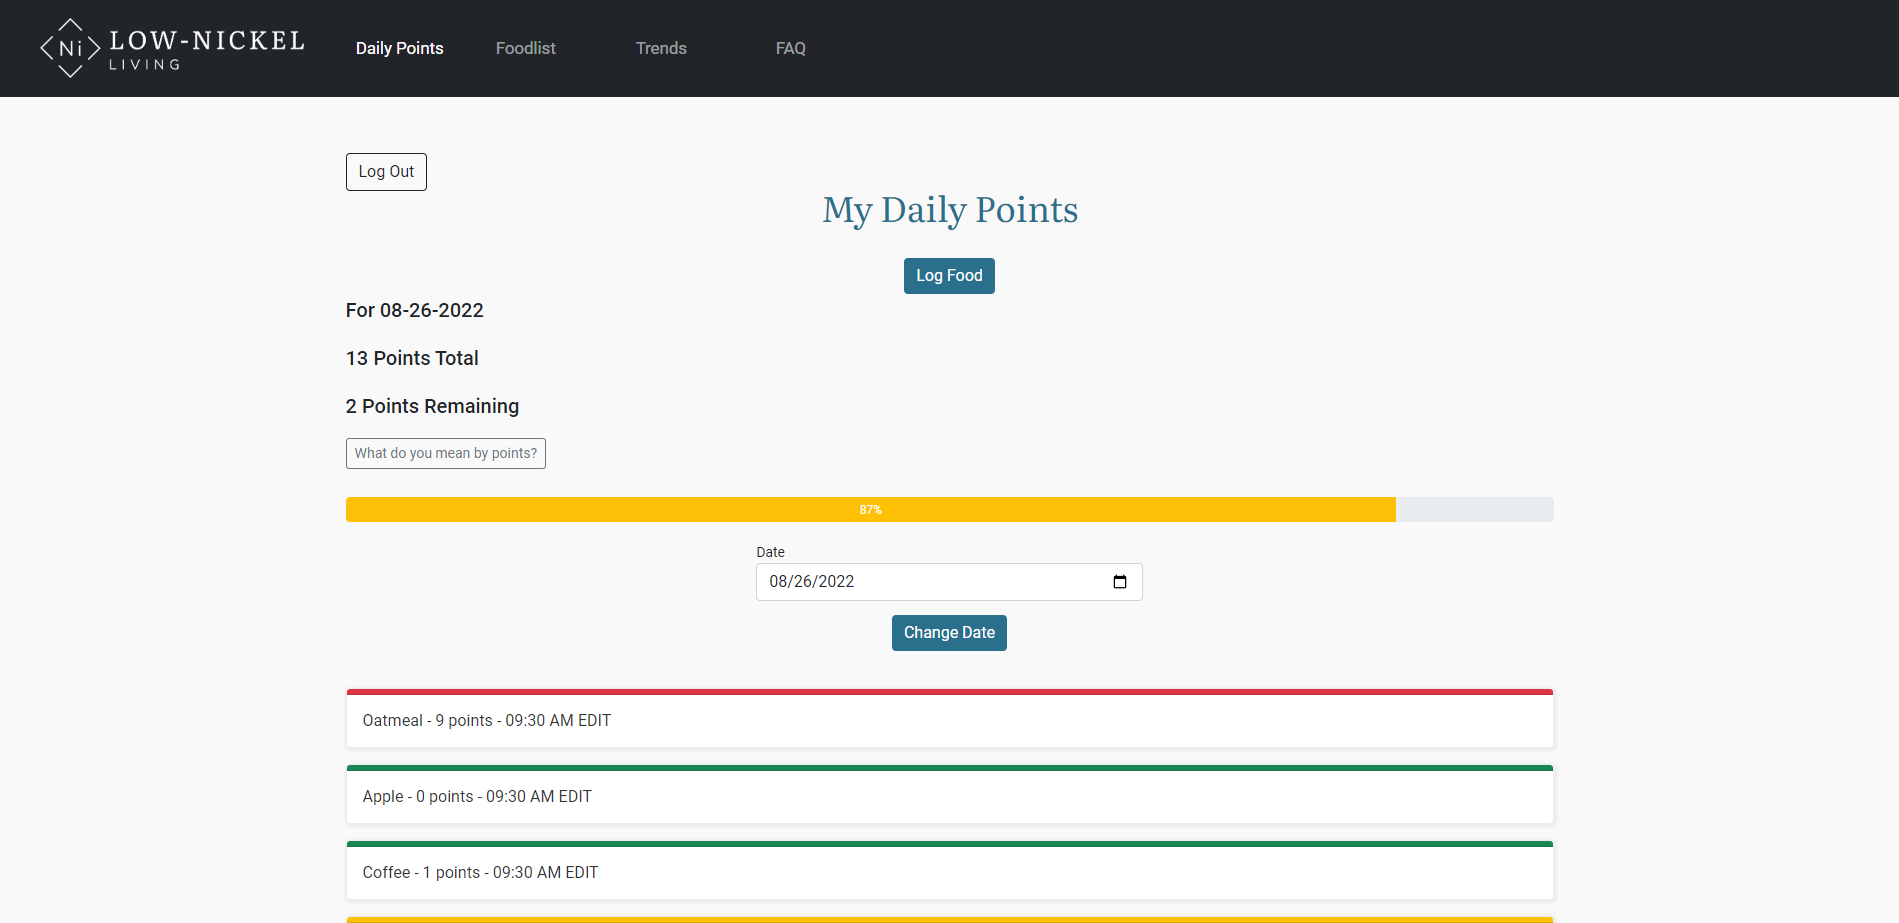
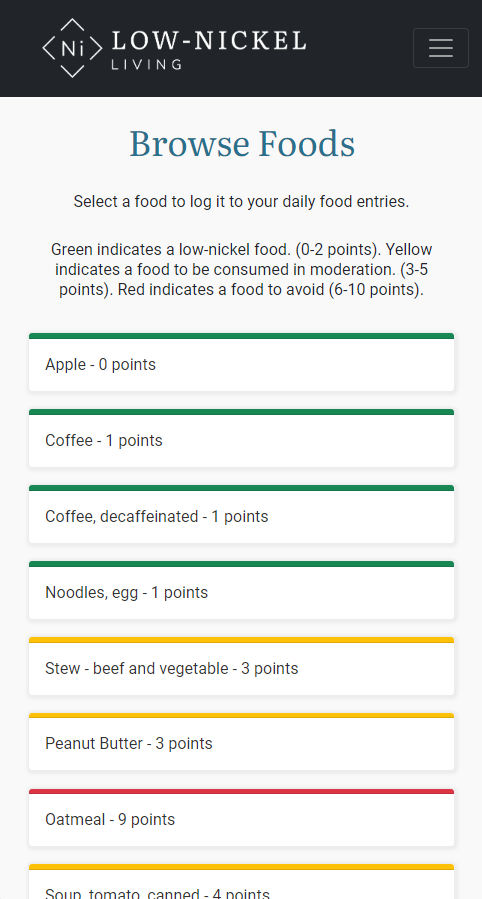
Color is used throughout the application to make actions, progress, and statistics stand out. I also used a muted green, yellow, and red throughout as intuitive visual indicators to enable the user to see at a glance whether a food is low in nickel (green) or high in nickel (red). I also used a green, yellow, or red progress bar to provide at a glance progress throughout the day.
Design System
I built the basics of a design system for my application in Figma, including foundational elements like colors and typography, as well as common components and how they should be used. I included the CSS and HTML code for my components as well. I believe one of the most powerful benefits of a design system is the consistency, time savings, and error reduction for developers in addition to designers.
Final Product
Please note that my final project was limited by what I could personally achieve in coding in a short amount of time. I used available frameworks, such as Bootstrap and Google Charts, to save time. There were many features (such as improvements to date/time display and interaction throughout or color-coding the trends graph) that I prioritized below other functionality and would need to research how to implement. The pages are not pixel perfect. But I am very proud of what I have accomplished with this application's functionality and feel it is a base to continue to iterate on from a design perspective.
Having coded the entire application myself, both the front and back-end, I understand the realities and limitations in implementing a design in code. I am able to empathize with developers and have a view into their world with it's highs and lows. This will serve me well throughout my User Experience career.
Mobile

Logging In
Browsing Foods

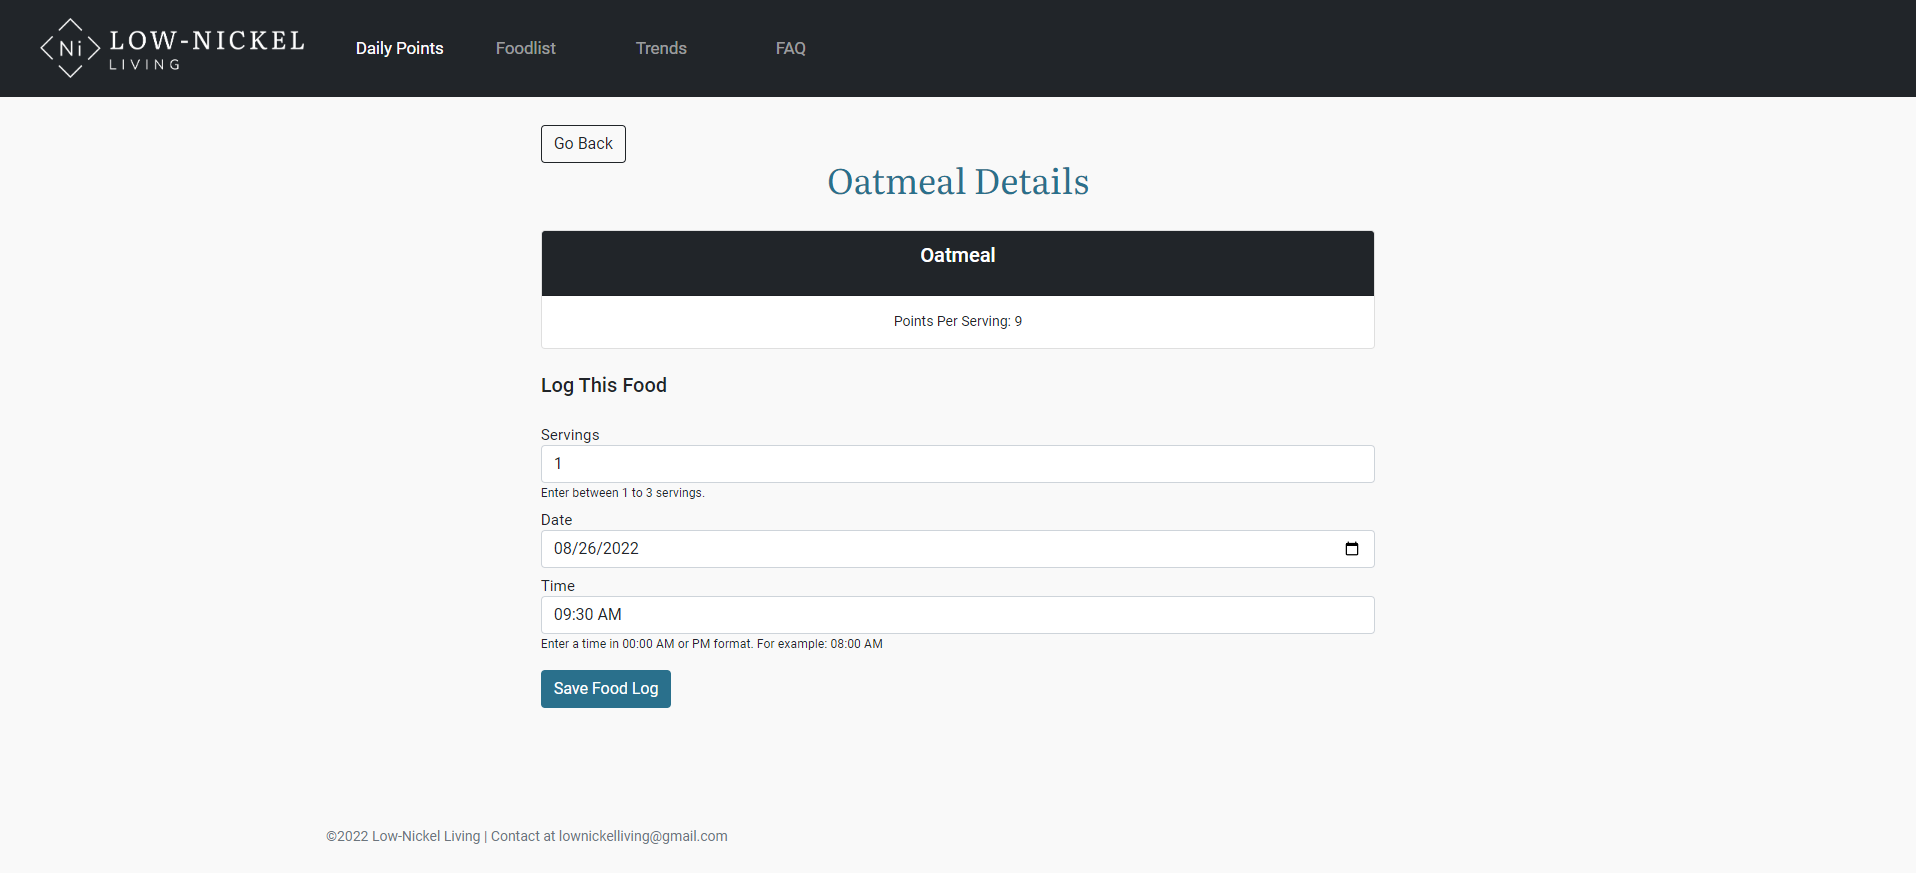
Logging Food

User Dashboard
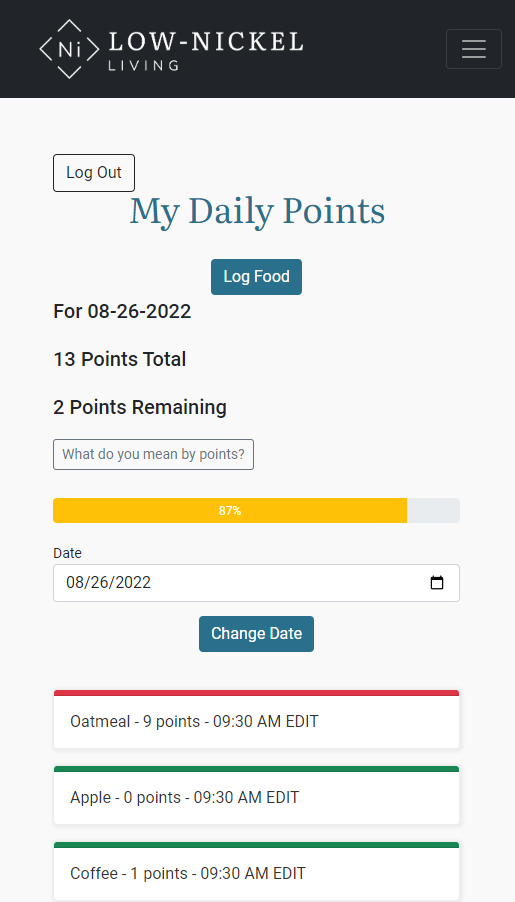
The progress bar turns yellow to warn the user.
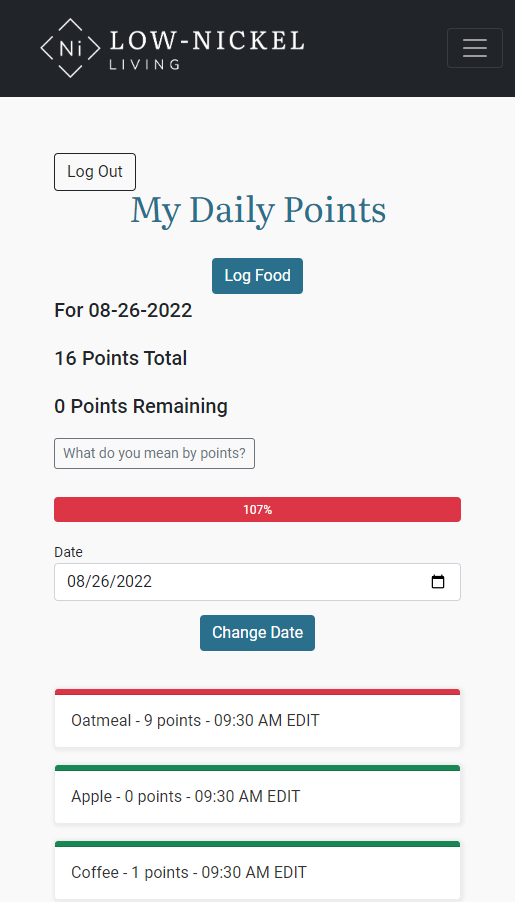
The progress bar turns red when the user goes over the daily limit.
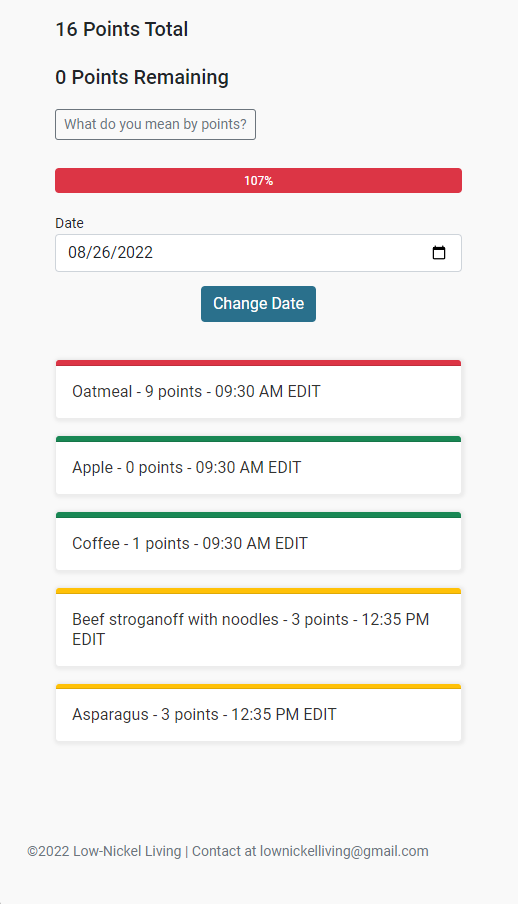
Foods logged for the day

Editing a log entry
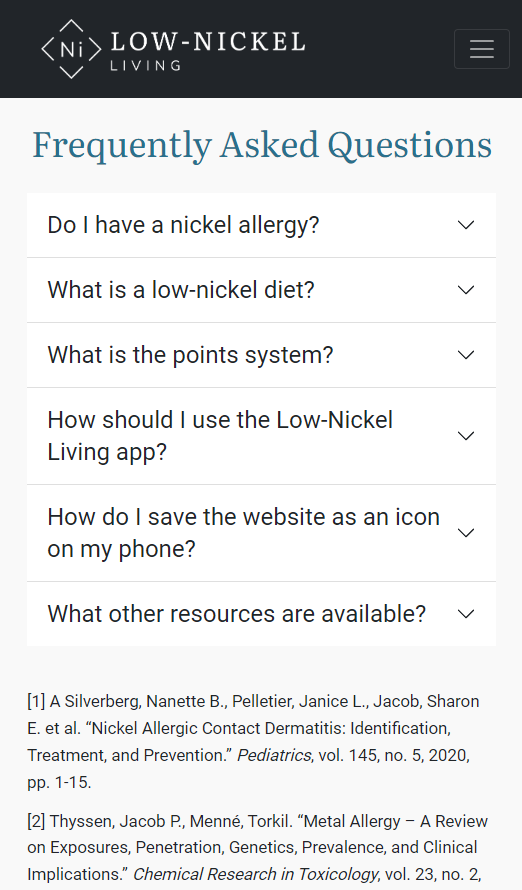
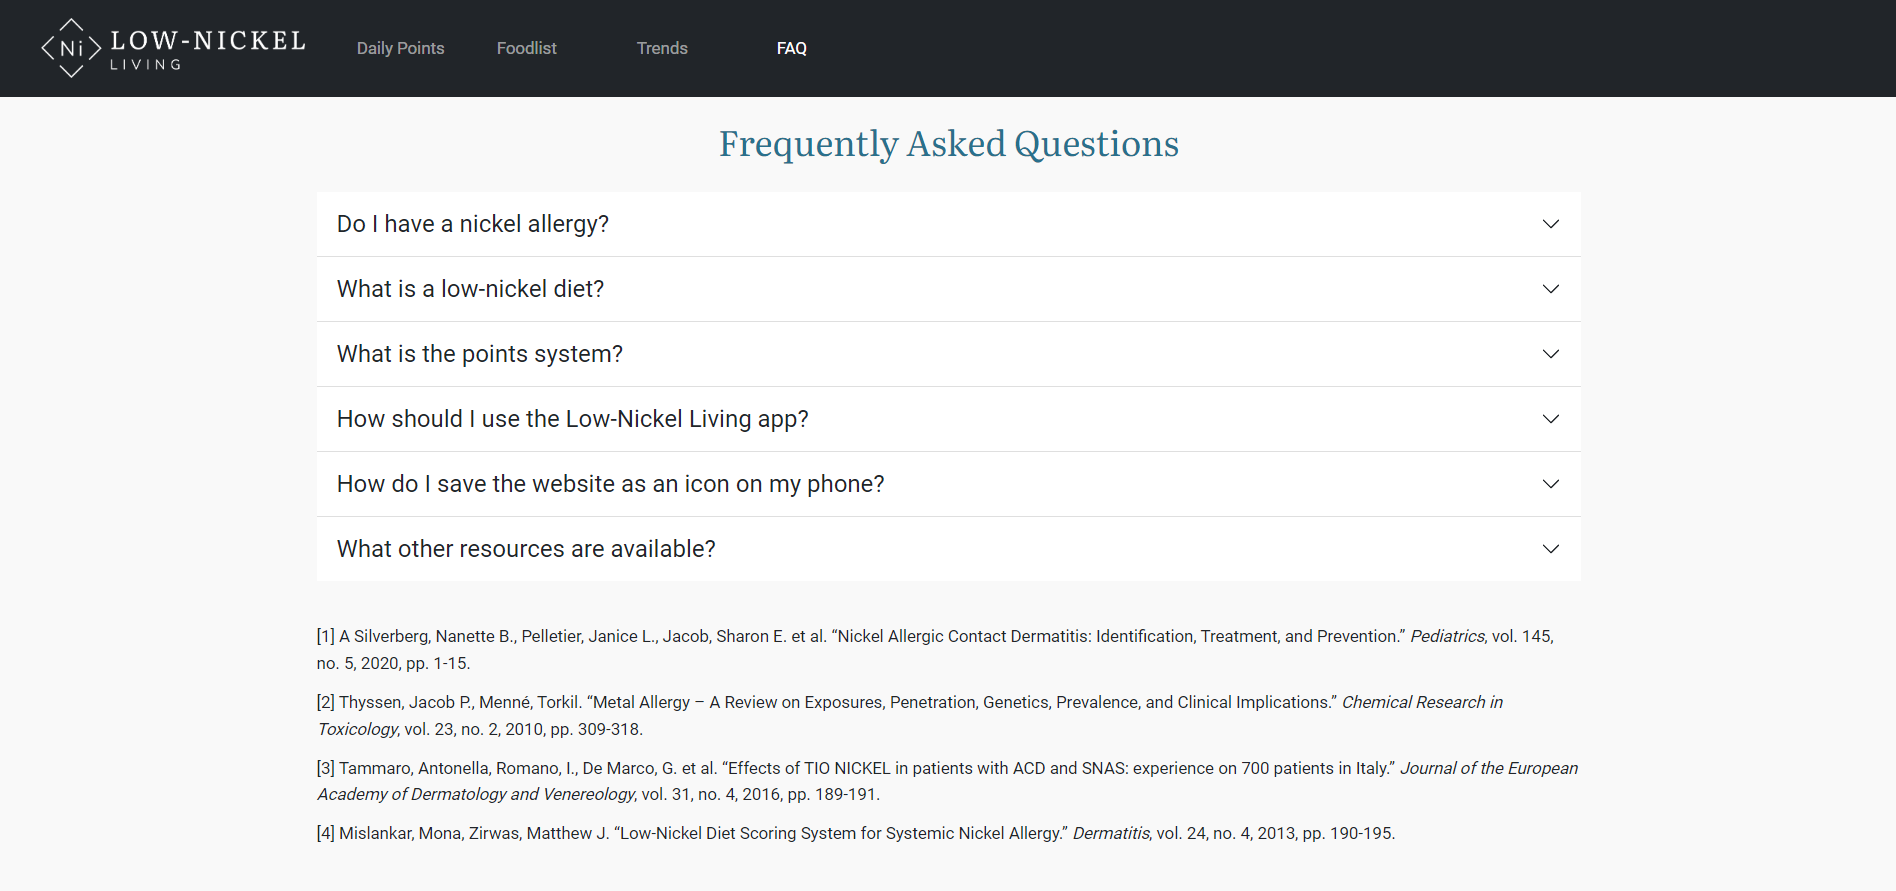
Frequently Asked Questions
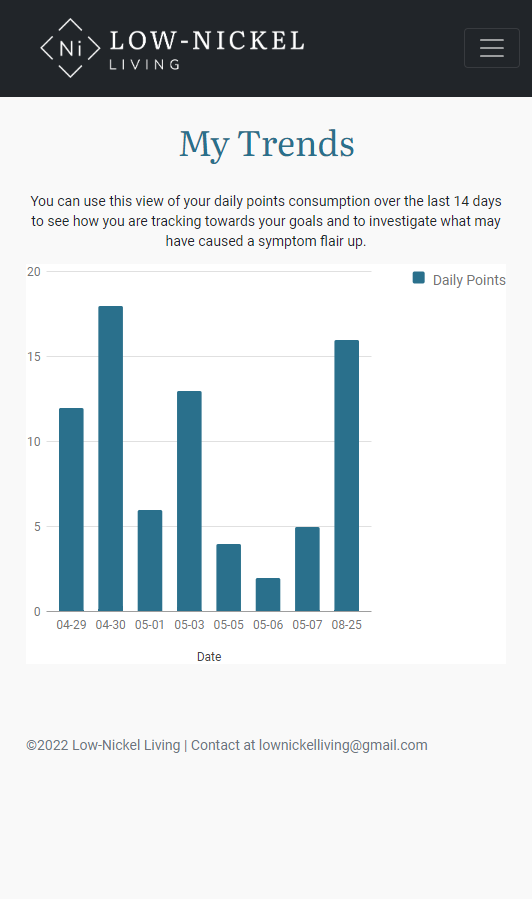
User Trends
Desktop
